
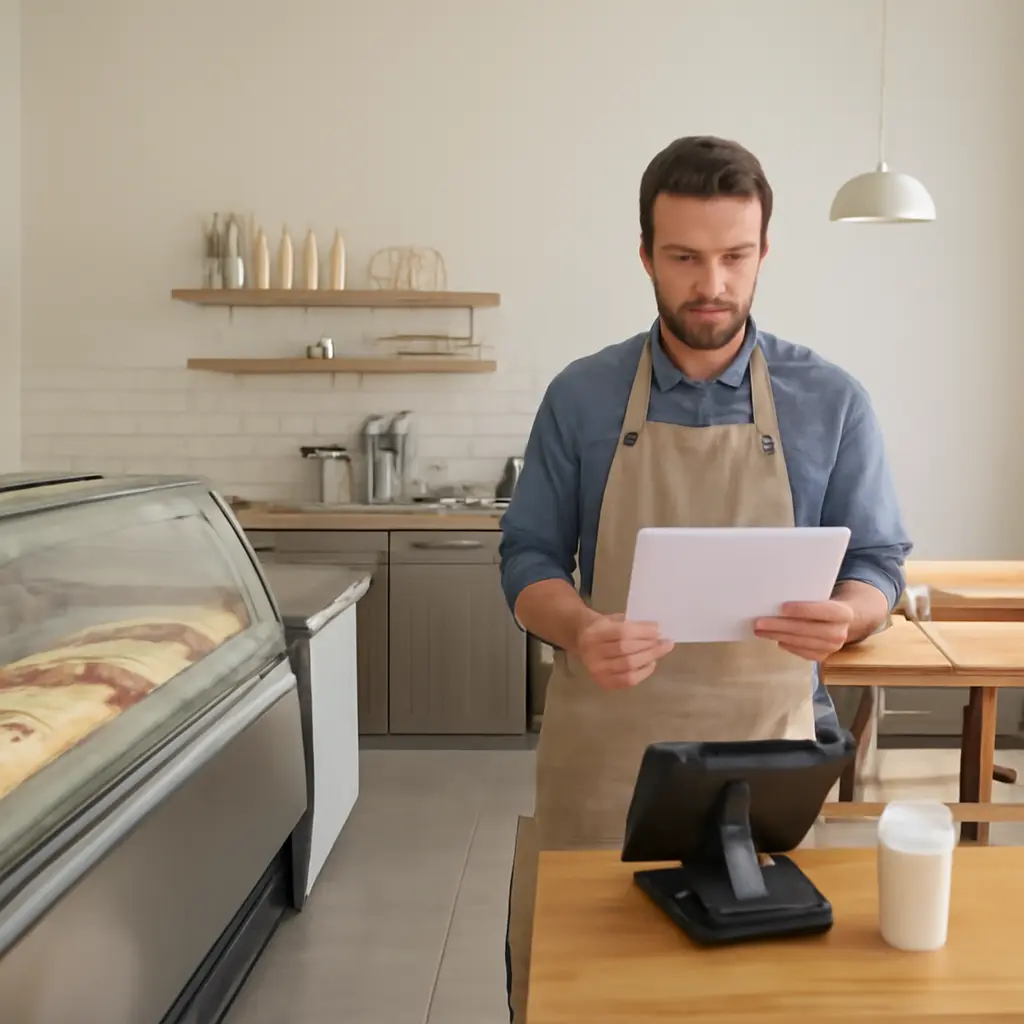
Experienced gelato owners use daily sales reports to understand not just how much they sold, but what drove sales, where money was lost, and what to prepare for tomorrow. A useful report connects net sales, transaction counts, average check, product mix, discounts, labor, and waste with context such as weather and promotions. The National Restaurant Association reports that food and labor are among restaurants’ largest operating costs, while the U.S. Bureau of Labor Statistics’ Consumer Expenditure data tracks food-away-from-home spending—good reminders that revenue alone cannot show whether a shop is performing well. The sections below explain the core metrics, how to read them together, and how to turn the numbers into practical operating decisions.
Daily Sales Reports Measure Gelato Shop Performance
A daily sales report is a dated record of a shop’s sales activity and related operating measures. There is no single universal definition prescribed for gelato businesses; in practice, point-of-sale (POS) systems assemble transaction data such as gross and net sales, taxes, refunds, payment types, discounts, and items sold. Owners make the report useful by reconciling it with cash handling, staffing, inventory, and the circumstances of the day.
The key distinction is between sales volume and business performance. A busy day can still produce weak results if discounts are heavy, the average order is small, labor is out of proportion to demand, or high-cost flavors dominate sales. Conversely, a lower-revenue day may be healthy if costs and staffing were adjusted appropriately. Daily figures are most informative when compared with the same weekday, a recent trend, or a budget—not with an unrelated day.
Net sales and transaction count
Net sales represent sales after applicable discounts and refunds, with taxes shown separately according to the POS and accounting setup. Transaction count is the number of completed checks or orders. Together they distinguish changes in demand from changes in basket size: if transactions rise while net sales remain flat, customers may be buying less per visit or using more discounts.
Owners should verify that the report’s sales definition is consistent from day to day. For example, sales tax collected for government is generally not shop revenue, and voids, refunds, or reopened checks can affect comparisons if handled inconsistently. A close-out routine that matches POS totals to payment settlements and cash counts helps identify discrepancies promptly.
Average check and sales per guest
Average check is net sales divided by the number of transactions. It is a practical indicator of how much customers spend per order, but a transaction is not necessarily one person: a family may place one check for several guests. Where reliable guest counts are available, sales per guest adds another perspective.
An owner might find that a promotion increased transactions but lowered average check. That can still be worthwhile if the offer brings in new customers or encourages repeat visits, but the report should be reviewed alongside discount cost and product margin. Tracking average check by daypart or channel can also reveal whether dine-in, takeaway, delivery, or catering orders behave differently.
Product-Mix Reports Reveal What Gelato Customers Buy
Product mix is the distribution of sales across items, categories, or variants. In a gelateria, useful groupings can include flavor, serving size, cup versus cone, toppings, drinks, packaged products, and seasonal specials. A POS item report shows units and sales; linking recipes and ingredient costs to those items can show whether popular products also contribute attractive margins.
Flavor and serving-size performance
Flavor-level sales help owners decide what to produce, display, and replenish. Units sold indicate demand, while sales dollars show revenue contribution. Neither alone establishes profitability: a premium ingredient, a larger portion, or frequent complimentary samples may change the cost of serving a flavor.
Compare the mix across similar weekdays and seasons, and interpret it in context. A warm weekend may shift demand toward refreshing fruit flavors, while a local event may lift family-size purchases. The report can support production planning, but owners should also account for batch yields, remaining pan inventory, shelf-life and food-safety requirements, and the time needed to make each flavor.
Add-ons, bundles, and cross-selling
Add-on reporting separates the base gelato sale from extras such as toppings, espresso, affogato, waffles, or packaged take-home tubs. Attach rate—the share of eligible transactions that include an add-on—can help assess whether menu placement or staff suggestions are working. It should be considered together with the add-on’s price, ingredient cost, preparation time, and customer experience.
A simple comparison can show whether a new bundle raises average check without merely discounting items customers would have bought anyway. Owners can compare units and net sales before and after a menu change, while noting other factors such as weather, holidays, and nearby events. This avoids treating a coincidental sales increase as proof that a promotion caused it.
Discounts, Refunds, and Payments Explain Sales Quality
Gross sales, discounts, refunds, and net sales describe different stages of the transaction. Reviewing them separately helps an owner see whether revenue changed because demand changed, a promotion was used more often, or corrections were issued. The restaurant industry’s thin operating economics make it especially important not to mistake a high gross-sales figure for money retained by the business.
Discounts and promotions
Discount reporting records reductions such as coupons, loyalty rewards, staff meals, and manager-authorized price adjustments. Track both the amount and the reason or promotion code. A discount’s success depends on its incremental effect: did it generate additional visits, increase the basket, or encourage a return visit enough to justify the reduction?
The National Restaurant Association’s industry reporting highlights the importance of managing food and labor costs in restaurant operations. That context supports evaluating promotions against contribution after variable costs rather than sales alone. A gelato shop can compare promoted items’ net sales and estimated ingredient costs with a similar non-promotional period, while recognizing that weather and seasonality can confound the comparison.
Refunds, voids, and payment reconciliation
Refunds reverse completed sales, while voids generally remove or correct a transaction before it is finalized; exact POS terminology varies. Review unusual amounts, repeated adjustments, and reasons, then reconcile card, cash, gift-card, and other tender totals with processor settlements and the cash drawer. This can surface entry errors, service problems, duplicate charges, or control issues.
Payment mix is also operationally useful. A shift toward card or mobile payments may affect settlement timing and processing fees, while cash differences require timely investigation. The daily report is a control tool, not a substitute for bank reconciliation or formal bookkeeping.
Labor and Waste Put Gelato Sales in Operating Context
Sales figures become more actionable when paired with the resources used to produce and serve them. Labor hours, labor cost, and product waste help owners assess whether staffing and production matched demand. These measures are shop-specific: accounting methods, payroll timing, recipe costing, and waste definitions should be documented before trends are compared.
Labor hours and sales per labor hour
Sales per labor hour is net sales divided by hours worked during the chosen period. It can indicate whether staffing levels broadly matched sales, but it does not measure service quality, prep work, training, or the complexity of a shift. A low figure may be reasonable on a quiet day when staff are making batches, cleaning equipment, or completing other necessary tasks.
Review labor by daypart and compare like periods, rather than responding to a single ratio mechanically. The U.S. Bureau of Labor Statistics publishes wage and employment information for food-service occupations, providing broader labor-market context; local wages, employer costs, and scheduling rules still determine a shop’s actual labor expense. Forecasts should incorporate expected traffic, events, opening tasks, and production needs.
Waste, transfers, and inventory movement
Waste reporting records product discarded or otherwise unavailable for sale, such as melted gelato, expired ingredients, production overages, or quality-control rejects. A useful log includes item, quantity, reason, and estimated cost. Transfers, samples, staff consumption, and complimentary servings should be classified consistently so they are not mistaken for unexplained shrinkage.
Daily sales can guide production, but they do not by themselves reveal inventory accuracy. Compare POS units with recipes, batch yields, opening and closing stock, and documented waste. If a flavor repeatedly sells out early, increase production cautiously; if it repeatedly remains unsold, adjust batch size, display strategy, or the schedule for offering it.
Daily Comparisons Turn Gelato Sales Data Into Decisions
A daily report is a snapshot. Experienced owners add comparison points and operating context so that a one-day fluctuation does not trigger an unhelpful reaction. A compact dashboard can show net sales, transactions, average check, sales mix, discount rate, labor hours, waste, and tender reconciliation, with comparison to the same weekday and a recent rolling average.
Weather, seasonality, and local events
Weather and calendar conditions can influence walk-in traffic and flavor preferences, so annotate reports with temperature, rain, holidays, school schedules, festivals, and nearby events. These notes help explain variation; they do not prove causation. Compare multiple similar periods where possible and avoid attributing a sales change to weather when a promotion, operating-hours change, or local event also occurred.
For example, if a shop’s transactions rise on a festival evening but average check falls, the owner can inspect whether smaller serving sizes or a high-volume offer drove the pattern. The next step might be to adjust staffing or prep for the event window, rather than changing the permanent menu based on one night.
A practical daily review sequence
- Confirm the reporting date, business hours, sales definitions, and close-out totals.
- Compare net sales and transaction count with the same weekday or an appropriate baseline.
- Check average check, product mix, discounts, refunds, and unusual item-level changes.
- Review labor hours, documented waste, stockouts, and remaining inventory.
- Record relevant context and choose one or two operational actions for the next shift.
A chart can make the review clearer: plot daily net sales and transactions together, then use separate panels for average check, discount rate, and labor hours. Keeping measures on separate axes prevents a large-dollar series from visually obscuring smaller but meaningful changes.
Conclusion: Gelato Daily Reports Support Better Decisions
The most useful gelato sales report combines net sales and transactions with average check, product mix, discounts, payment reconciliation, labor, and waste. Comparing these measures with similar days—and annotating weather, seasonality, and events—helps owners distinguish real trends from one-off variation. Start with consistent definitions, review exceptions rather than only totals, and use the findings to guide production, staffing, menu tests, and cash controls. Owners can further improve their reporting by consulting POS documentation, industry operating-cost research, and local accounting or food-safety guidance.
Sources: National Restaurant Association, 2024 State of the Restaurant Industry Report, https://restaurant.org/research-and-media/research/research-reports/state-of-the-restaurant-industry/; U.S. Bureau of Labor Statistics, Consumer Expenditure Surveys, https://www.bls.gov/cex/; U.S. Bureau of Labor Statistics, Occupational Employment and Wage Statistics, https://www.bls.gov/oes/.